One of the things that the GCIA study has taught me is that being able to monitor the network your computer is on is a critical necessity to maintaining a secure network. Corporate environments can set up IDS devices to monitor traffic however monitoring doesn’t work unless you have proper connectivity to what you want to monitor. Unfortunately, most of us don’t have central wiring in our house and expensive managed switches that can set up span sessions with which to monitor traffic in transit. In this HOWTO, I will cover how to build your own monitoring connection that you can use on your own network to monitor traffic without breaking the bank. This article is first in a three part series on how to build your own home IDS for monitoring your network traffic. Look for the other two sections soon!
A little bit more info first…
In the early days of affordable Ethernet networking, devices called hubs (or repeaters) were used to bring the signals together from each workstation in order to allow the workstations to communicate with each other. When a packet was sent to the hub, the hub repeated the packet across all ports on the device and all other workstations would receive it, even if it was not destined for that particular workstation. The hubs gave way to switches as networking technology became cheaper and faster. Unfortunately, the switches also changed the old way of signal transmission. When a workstation sends a packet to a switch, it is sent from the sender’s switch port and arrives at the switch port of the workstation that the packet is destined to. It does not get sent to other workstations’ switch ports unlike the hub’s transmission method. Because of the need for network monitoring, more advanced switches started offering monitor ports (Cisco calls them span sessions) that are used to forward all traffic that goes through a switch out of this specifically configured port. This port would then be connected to the monitoring device and would allow the monitoring device to “listen” to all packets that traversed the switch.
The good thing is that most if not all managed switches support a monitor port however the bad thing is that a managed switch is way outside the pocketbook of most home network users.
But why not use a hub?
A hub would allow us to listen in on network traffic however a hub would degrade your network’s performance thanks to it’s lack of proper high speed flow control and its susceptability to collisions. In my testing, I used a 100baseT hub between my firewall and my network and found that my previously rock solid network connection had dropped well below speed and would barely support YouTube streaming, much less Netflix. Instead of using a hub and risking continued degradation, I decided to research another solution.
So, what’s the solution and how do I use it?
The solution is the Passive Tap. This device sits between a unmanaged switch and a computer or router and allows a monitor device to listen in on the network connection between a computer and switch. The word passive in this instance means that there is no way to detect the device’s presence. It does not have a MAC address, it does not repeat. For all intents and purposes, the tap does not exist.
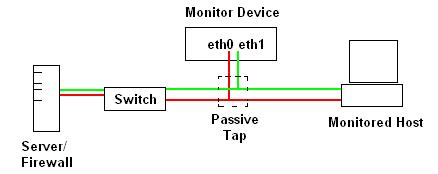
In the image above, we have connected the Passive Tap between a network switch and a monitored host in order to monitor traffic between the host and other machines on the network (in this case the Server). This would be an ideal setup for monitoring traffic generated by the monitored host and the rest of the network with the focus being on the monitored host. In this configuration, the monitor device would pick up all traffic destined to or originating from the host and any broadcast traffic generated by the network.
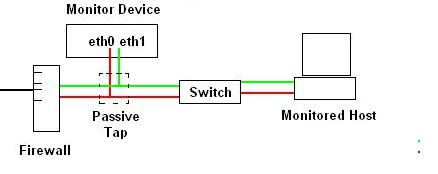
This configuration is a bit different than the first image however the scope of the monitor device’s visibility has changed. Instead of just monitoring the Monitored Host, this configuration allows the monitor device to monitor any Internet traffic that passes between any host on the switch and the firewall. If there were additional devices connected to the switch (other desktops, an Xbox, a Wifi Access point, etc..) their communication with the Internet would also be monitored. The only communication that would not get monitored would be communication between the devices plugged into the switch (for example the Monitored Host and a Wifi Accesspoint, etc.)
Parts List
In order to build a passive tap, you will need the following items. The parts themselves cost me about $20 at a computer store which is a lot better than the $200 that some eBay sellers want.
- A cat-5 patch cord
- A surface mount biscuit jack / modular mounting box. (See picture below)
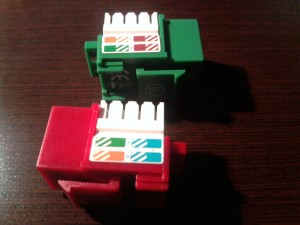
- Two CAT5 keystones (they don’t have to be green/red like mine)
- Screwdriver
- Wire cutters/blade
- A M110 punch down tool (If you have one, it makes the installation easier)
- A monitoring computer with two network interfaces and Wireshark installed (windows) or tcpdump(linux)
- A test computer (or device) with one network interface
- A network switch.
- Beer (optional)
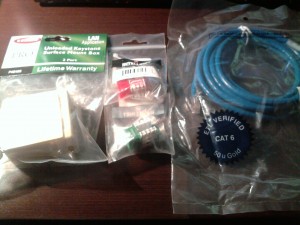
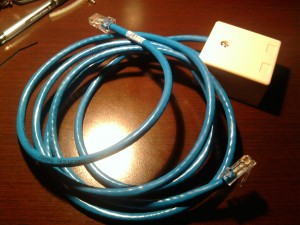
Here’s an image of the parts. The biscuit jack on the left, the two keystones are in the center and the patch cord is on the right.
We’ll start off by first taking a look at the keystones up close.
These keystone jacks are wired up and marked in such a way that all you need to do to wire it up properly is to follow the color code. A closer inspection will reveal that there are small numbers in between the symbols for the wire positions. In this page on twisted pair wiring, you can see that of the four pairs in a Cat-5 10/100 cable, only pairs 2 (white/orange) and 3(white/green) are used. In order to properly receive both sides of the conversation on the wire, we will need to “tap” into both pairs and route them to the proper pins on the two keystones to each jack’s Pair 2 (receive pair) so that the data being sent can arrive at the NIC of our monitoring device.
If you scroll down to the section labeled “568A and 568 B Color Schemes”, you will see that the receive pair is on pins 3 and 6 of the diagram jacks. Our keystones are similarly labelled and when we are done, we will have one pair of the Cat-5 patch cable going to pins 3 and 6 of one jack, and the other pair of the Cat-5 patch cable going to the other jack.
Let’s get started.
First off, it is important to understand that you must be able to do this WITHOUT NICKING OR CUTTING THE WIRES. A cut or nick could result in either your tap not working properly or the tap getting all the data but your connected host doesn’t or any one of a whole handful of issues. Thankfully, Cat-5 patch cords are not very expensive, but it still sucks to put a project on hold because a slip of the knife.
To start, lay out the patch cord and decide on where you want the tap. Since the hosts are closer to my monitor machine, I’ve decided to create a short end and a long end with the tap being more towards one end. You may want to have the tap in the middle or very close to one end of your patch. It electrically does not matter.
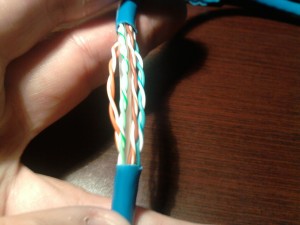
Strip back about two to three inches of jacket so that you have something like below.
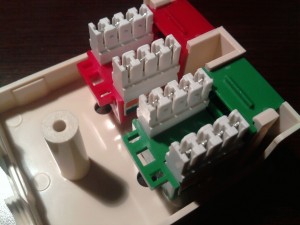
Mount the keystones in the surface mount box as shown below.
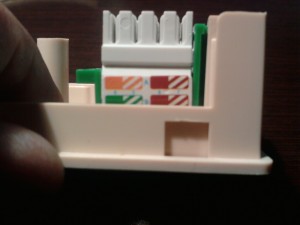
Now that they are mounted, we will then need to take a look at which pair of pins we need to match the wires up to. Below is a better side-view pic of the green jack in detail. Please note, your jacks may appear different, but all CAT5 keystone jacks that I have seen have both a color designation and a numeric designation. Be sure to pay attention to which is which and where you are placing your wires otherwise it may not work.
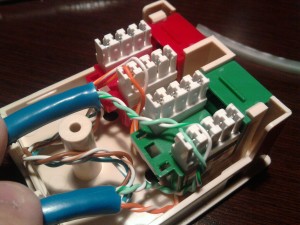
You can click on the picture for a larger more detailed image. In the above image (using the top set of colors as a guide) we see that the orange/white hash is pin 3 and the solid orange is pin 6. The same goes for the red jack (not shown). That being said, untwist the orange and green wires, and place them into their respective slots. Make sure that the solid wire goes with the solid pin and the hashed wire goes with the hashed pin. A reversal here will cause the monitor port not to receive data and could affect your host/switch.
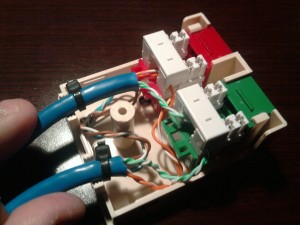
In the above photo, you can see that the white/orange pair are lightly inserted into the wire channels. If you don’t have the M100 punch tool, you can get away with using the wire caps that came with your keystones. These caps will push down the wire and crimp it into place over a metal pin that connects the wire to the pin in the jack. When you are done, you will have something akin to the below:
Also of note: To act as a strain relief, I have added tiewraps on the cable. This will serve to protect the cable from getting yanked out and damaged. In this picture, you can also see the two white caps that have punched the wires down in place. Reassemble the jack and make sure to install the screw in the lid if your jack has one.
Here’s the completed tap in all it’s glory!
Testing the Tap
In order to test the tap, we need at least two computers, one of which must have two network adapters. The computer with one network adapter will be our “test host” and the other computer will be our monitoring host. On the test host, I have assigned the IP address 10.0.0.2 and on the monitoring computer, I have assigned one interface (eth0) with the IP of 10.0.0.1. The monitoring interface (eth1) will have no IP address assigned to it and will be for testing the tap. Remember that as far as the test host is concerned, the tap is just a CAT-5 patch cable.
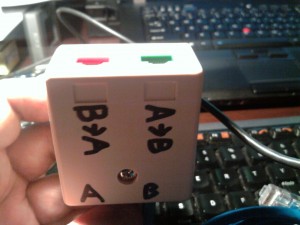
Before proceeding, mark the passive tap where the Ethernet cables come out as A and B. This will be important as this test will also help us label which side of the conversation we are listening to. One side will be considered “Network to Host” and the other will be considered “Host to Network”. It is imperative that we get both sides of the conversation, each side represented by one of the two keystone jacks. While it might not be important now, later on when you use this tap for something else (like an IDS project), you will need to know which side of the conversation you are listening to.
To get your test rig set up, connect the long side (side A in my case) of the tap cable to the switch. Connect the short side (side B in my case) to the test host. Connect the ethernet interface on the monitoring machine to the switch, but leave the unmonitored interface disconnected. Keep in mind that on my monitoring machine, eth0 was the interface with the IP address, and eth3 was the interface that will be used for monitoring. I’m using Linux on my system, you may need to make adjustments where needed.
- On the monitoring host, ensure that you can ping the test host before hooking up the monitoring interface to the tap.
- On the monitoring host, open two terminal windows
- In the first window, start tcpdump using this command: sudo tcpdump -i eth3 -nvs0 -c 10 ip[9]=1This translates to start tcpdump on eth3, no host resolution (-n), verbose mode (v), no snapshot length (s0), for a count of 10 packets (-c 10) and only on ICMP protocol (ip[9]=1).
- Attach the monitoring interface to one of the two keystones. I picked the red jack.
- In the second window, ping the test host using the -c 5 parameter: ping testmachine -c 5 The -c 5 tells ping to try 5 times.
- You should see the below text in your ping window:
$ ping  testmachine -c 5
PING testmachine (10.0.0.2) 56(84) bytes of data.
64 bytes from 10.0.0.2: icmp_seq=1 ttl=64 time=7.25 ms
64 bytes from 10.0.0.2: icmp_seq=2 ttl=64 time=0.685 ms
64 bytes from 10.0.0.2: icmp_seq=3 ttl=64 time=0.719 ms
64 bytes from 10.0.0.2: icmp_seq=4 ttl=64 time=0.746 ms
64 bytes from 10.0.0.2: icmp_seq=5 ttl=64 time=0.704 ms
- Your TCPDUMP window should show something like this:
21:48:59.093624 IP (tos 0x0, ttl 64, id 27270, offset 0, flags [DF], proto ICMP (1), length 84)
 10.0.0.2 > 10.0.0.1: ICMP echo reply, id 24899, seq 1, length 64
21:49:00.088502 IP (tos 0x0, ttl 64, id 49871, offset 0, flags [DF], proto ICMP (1), length 84)
 10.0.0.2 > 10.0.0.1: ICMP echo reply, id 24899, seq 2, length 64
21:49:01.087486 IP (tos 0x0, ttl 64, id 36772, offset 0, flags [DF], proto ICMP (1), length 84)
 10.0.0.2 > 10.0.0.1: ICMP echo reply, id 24899, seq 3, length 64
21:49:02.086630 IP (tos 0x0, ttl 64, id 27025, offset 0, flags [DF], proto ICMP (1), length 84)
 10.0.0.2 > 10.0.0.1: ICMP echo reply, id 24899, seq 4, length 64
21:49:03.085505 IP (tos 0x0, ttl 64, id 28037, offset 0, flags [DF], proto ICMP (1), length 84)
 10.0.0.2 > 10.0.0.1: ICMP echo reply, id 24899, seq 5, length 64
- Keep in mind that there are two packets associated with ping. One is an ICMP Echo Request and the other is an ICMP Echo Reply In this case I received the echo reply which means that the red jack is for “Host to Network” monitoring or B->A. If you got ICMP echo request, then your jack is A->B.
- Mark the jack as B->A and continue testing. At this point, we know that our tap at least hears half the conversation.
- Switch the monitor interface to the other jack (Mine is green) and rerun the ping. Your ping should show the below just like before:
$ ping 10.0.0.2 -c 5
PING 10.0.0.2 (10.0.0.2) 56(84) bytes of data.
64 bytes from 10.0.0.2: icmp_seq=1 ttl=64 time=9.69 ms
64 bytes from 10.0.0.2: icmp_seq=2 ttl=64 time=0.705 ms
64 bytes from 10.0.0.2: icmp_seq=3 ttl=64 time=0.663 ms
64 bytes from 10.0.0.2: icmp_seq=4 ttl=64 time=0.722 ms
64 bytes from 10.0.0.2: icmp_seq=5 ttl=64 time=0.714 ms
- This time, however, the TCPDUMP output should have changed:
22:00:28.084339 IP (tos 0x0, ttl 64, id 0, offset 0, flags [DF], proto ICMP (1), length 84)
 10.0.0.1 > 10.0.0.2: ICMP echo request, id 40269, seq 1, length 64
22:00:29.077220 IP (tos 0x0, ttl 64, id 0, offset 0, flags [DF], proto ICMP (1), length 84)
 10.0.0.1 > 10.0.0.2: ICMP echo request, id 40269, seq 2, length 64
22:00:30.076215 IP (tos 0x0, ttl 64, id 0, offset 0, flags [DF], proto ICMP (1), length 84)
 10.0.0.1 > 10.0.0.2: ICMP echo request, id 40269, seq 3, length 64
22:00:31.075218 IP (tos 0x0, ttl 64, id 0, offset 0, flags [DF], proto ICMP (1), length 84)
 10.0.0.1 > 10.0.0.2: ICMP echo request, id 40269, seq 4, length 64
22:00:32.074214 IP (tos 0x0, ttl 64, id 0, offset 0, flags [DF], proto ICMP (1), length 84)
 10.0.0.1 > 10.0.0.2: ICMP echo request, id 40269, seq 5, length 64
- Just like before, I received 5 packets however last time I got the ICMP echo reply, this time I got the ICMP echo request. This means that the green jack is the A->B connector, that is Network to Host. Mark it as appropriate.
If you’re at this point, then you have demonstrated that the tap works. It allows the test host to communicate with the network unimpeded, it also allows the monitoring of host to network and network to host data. My passive tap looks like the one below:
Now what to do?
At this point, with a good passive tap in hand, you have a whole bunch of things you can do. You could:
- Establish an IDS for your network (my original plan)
- Monitor a host’s traffic exchange with the network/Internet.
- Perform traffic reconstruction for analysis.
- Monitor network communication between your Wireless access point and the rest of your network
Troubleshooting
Unfortunately, I can’t account for every situation however there may be some situations where the tcpdump test doesn’t exactly work as planned. Here’s some common solutions if your tests don’t work quite right:
I can see the A->B traffic, but can’t see the B->A traffic. The ping window shows the host responds. (or)
I can see the B->A traffic but can’t see the A->B traffic. The ping window shows the host responds. (or)
I can not see any traffic, but the ping window shows the host responds.
Check your wires on the keystone and make sure the wire went down onto the metal pin. Sometimes when using the caps to crimp down the wires, one of the wires will shift at the last second.
I can see the ICMP Echo Request on one port but I see nothing on the other. The ping window shows that the host does not respond.
Check to see that the wires didn’t rip apart or that they were not nicked in the construction process.
Last Thoughts
Even if you don’t plan on building a home IDS, having a passive tap in your toolbox is a good idea. You never know when you will need to intercept and analyze traffic between two devices on a network. This device will allow you to do so with minimal effort and cost all while allowing the host to chatter away unimpeded by the monitoring.
Happy Hacking!
FIRESTORM_v1
